Types of electrical circuits
It is also worth recalling that a diagram is a drawing made in symbols or interconnected blocks. Circuits related to electrical networks are called electrical circuits.
By type, electrical circuits are divided into schematic and installation. The first ones are made in symbols and show the connection between the elements of an electrical circuit. The second ones show the actual location of the circuit elements, indicating installation techniques and methods.
By type, electrical circuits can be:
- Schemes of primary and secondary circuits;
- Fully linear and single-line;
- Brief and detailed.
Let me remind you that a type is a group of schemes with common features. The types and types of electrical circuits overlap. For example, the primary circuit diagram can be three-line or single-line, schematic or expanded installation.
Primary circuit diagrams
These are electrical circuits for the generation, conversion, transmission and distribution of electrical energy. These diagrams are basic diagrams showing the main flow of electrical energy from sources to consumers.
Secondary circuits
These are diagrams of electrical circuits with voltages up to 1000 V. These diagrams of secondary circuits (PUE Chapter 3.4) are control, alarm, control, automation and relay protection schemes for electrical installations with voltages up to 1 kV.
Single-line
These diagrams show the electrical equipment of only one phase.
Full linear circuit
This is a diagram of all three phases of the circuit. The third name is three-phase circuit diagram.
Brief and detailed diagrams
Expanded diagrams display functional groups of electrical circuits, for example, a separate on/off circuit for an electrical switch.
In addition to the listed diagrams, you can add a cable routing diagram.
TYPES OF ELECTRICAL DIAGRAMS USED IN DISTRIBUTION NETWORKS
circuits are widely used in electrical networks . The concept schema has the following meanings:
1. Scheme - drawing, graphic representation of electrical equipment and communication circuits. Schemes of primary and secondary circuits, protection, signaling, control, etc. are distinguished by purpose. Schematic diagrams and wiring diagrams are also distinguished. There are many other schemes. In this article we will look at the diagrams of primary and secondary circuits, basic, full-line, single-line, installation and deployed.
2. A circuit is a set of elements and communication circuits between them that performs a specific function. For example, at substations a distinction is made between the electrical equipment of the main circuit and its own needs.
Primary circuits are the circuits of the main technological voltages through which the main flow of energy passes from sources to receivers (consumers). The purpose of primary circuits is the generation, transformation, transmission and distribution of electrical energy. Primary circuits are divided into the main circuit and their own needs.
Main circuit circuits are circuits designed to generate, convert and distribute the main flow of electricity.
Own needs are intended to ensure the operation of basic equipment, including electrical equipment, for example, power supply to electric motors of fans, electric lighting of the installation, etc.
Secondary circuits are circuits with voltages up to 1 kV, designed to perform control functions, including dispatching, automation, protection, monitoring, measurements, electricity metering, alarms, etc.
Electrical circuits are divided into full-line and single-line.
A full-linear (in three-phase circuits - three-linear) diagram is characterized by the fact that it shows the electrical equipment of all (three) phases.
A single-line diagram differs in that it shows the equipment of only one (middle) phase. If any equipment is not installed in all phases, then this difference must be shown on the diagram. For example, if current transformers (CTs) are installed only in phases A and C, then the single line diagram should show the CTs in those phases.
An electrical single-line diagram of the main circuits with brief characteristics of the main electrical equipment is called the main diagram.
A schematic diagram is a diagram in which, in order to simplify and better understand the principle of operation of an object, minor elements not related to the task under consideration are not shown.
Wiring diagrams are necessary for the installation of equipment and electrical connections. Installation diagrams vary in purpose. Let's mention just a few of them.
The switchgear filling diagram is a single-line diagram drawn against the background of the construction part (structure plan).
Cable route diagram is a designation against the background of a simplified master plan of routes and structures of cable lines, transformer substations and distribution points.
Detailed diagrams of secondary circuits are widely used during installation and commissioning work. In such diagrams, functional groups of circuits are distinguished, for example, turning on and off a switch, separate protection, etc. In this case, it often turns out that the winding of the control relay of a device is located in one part of the circuit, and its contacts are in different parts of it.
Table. Symbols in electrical diagrams:
| E | EMF source |
| R | Resistor, active resistance |
| L | Inductance, coil |
| WITH | Capacitance, capacitor |
| G | Alternator, power system |
| M | AC motor |
| T | Transformer |
| Q | Power switch (for voltage above 1 kV) |
| QW | Load switch |
| QS | Disconnector |
| F | Fuse |
| Busbars with connections | |
| Detachable connection | |
| QA | Automatic switch for voltage up to 1 kV |
| KM | Contactor, magnetic starter |
| S | Switch |
| TA | Current transformer |
| TA | Zero sequence current transformer |
| TV | Three-phase or three single-phase voltage transformers |
| F | Arrester |
| TO | Relay |
| KA, KV, KT, KL | Relay coil |
| KA, KV, KT, KL | Contact making relay |
| KA, KV, KT, KL | Relay break contact |
| CT | Timing relay contact with time delay |
| CT | Time relay contact with reset delay |
| Measuring device indicating | |
| Measuring recording device | |
| Ammeter | |
| Voltmeter | |
| Wattmeter | |
| Varmeter |
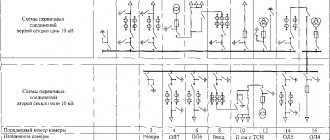
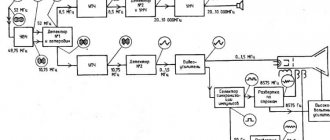
In Fig. 1 to explain the stated provisions, full-line and single-line diagrams of a cable line cell (W) and detailed diagrams of the secondary circuits of the same cell are shown.
The full-linear diagram (Fig. 1 a) shows the primary circuits of the line cell and its current cutoff (instantaneous relay protection against interphase short circuits connected to current transformers (CTs) in phases A and C). The line is equipped with a switch Q and two disconnectors QS1, QS2. The single-line diagram (Fig. 1 b) shows only the primary circuits of the same cell, i.e. switch Q, disconnectors QS1, QS2, TT and connections between them. The expanded diagram (Fig. 1c) separately shows a diagram of alternating current circuits (secondary circuits of current transformers TA installed in phases A and C. It also separately shows a diagram of operational circuits (i.e., necessary for the purposes of control, protection, automation and signaling) current. From the diagram of the operational current circuits, you can understand how line protection works. In the event of a short circuit (short circuit) on the line, relays KA1 and KA2 (one or both, depending on the type of short circuit) come into action (triggered). intermediate relay KL, which closes its contact.As a result, through block contact SQ of switch Q, power is supplied to the tripping electromagnet of switch YAT, which disconnects the faulty line.
Rice. 1. Diagrams of a cable line cell: a - full-linear; b—single-line; c—detailed diagrams of the secondary circuits of the cell (on the left - alternating current circuits, on the right - operating current)
Output documents.
· calculation of loads using the VNIPI Tyazhpromelektroproekt method (Moscow);
· single-line power diagram (graphic);
· single-line power circuit (tabular - GOST 21.613-88);
· specification of equipment, products and materials C1.
Distinctive features.
Design begins with specifying the configuration of the supply and distribution networks. The user sets the main characteristics of starting and protective equipment, cable lengths in accordance with the equipment layout plan, types of installation environments for electrical receivers and distribution equipment. The program includes a fairly extensive database of possible electrical receivers.
Based on the network configuration and data from electrical receivers specified by the user, loads are calculated. Drawings of supply and distribution networks are also automatically created.
The selection of equipment is carried out based on the results of the calculation, as well as the selection of cross-sections of conductors and protective pipes.
It is planned to enter floor plans from Autocad drawings to draw cable routes and automatically determine the lengths of these routes.
When working, it is necessary to take into account and comply with the requirements of the following guidance documents:
RTM 36.18.32..4-92 (Guidelines for calculating electrical loads)
· Manual for “Instructions for calculating electrical loads” (2nd edition)
· Electrical working documentation. General requirements and recommendations for composition and design (Instead of VSN381-85)
GOST 21.613-88 (Power electrical equipment. Working drawings)
· GOST 21.614-88 (Images of conventional graphic electrical equipment and wiring on plans)
GOST 28249-93 (Short circuits in electrical installations. Calculation methods in AC electrical installations with voltage up to 1 kV)
Selecting a power supply scheme based on a technical and economic calculation
Selecting an external power supply scheme
The purpose of technical and economic calculations is to determine the optimal option for the power supply scheme, the parameters of the power network and its elements.
The most economical electrical installation option requires the lowest value of total reduced costs (C)
= (7.1)
where is the standard investment efficiency ratio
= 0.33, s. 57/2/;
— total capital costs;
— annual production costs (annual operating costs), rub./year.
Capital investments ( ) are determined by the formula
= , (7.2)
where are the capital costs of installing high-voltage equipment and pipes;
— cost of installation and material of the power line;
(7.3)
where is depreciation deductions (deductions for depreciation and major repairs), rubles/year;
— costs caused by losses of electricity (EE) in the designed electrical installation for the year, rub./year
(7.4)
where is the depreciation rate.
(7.5)
where =1.2 rub/.kWh is the average cost of electricity in the power system;
— annual losses of electricity in an electrical installation, thousand kWh/year.
Diagrams of external power supply options for a mechanical repair plant are presented in Figure 7.1, 7.2, 7.3.
Let's choose the cross-section of the cable line for each option; for this we determine the calculated currents in normal ( ) and heavy ( modes:
335.652A (7.6)
671.303A (7.7)
where Sp
= 11627.31 - total design power, determined by formula (3.28), kVA;
10.00 kV - rated voltage for option I, Figure 7.1.
For =2×355 = 710 A, we select ASB brand cable with cross section F = 2×240 mm, table 7.35 /4/.
Let's check the cross-section of this line based on the permissible voltage loss, which in normal mode is ±5% of rated power,
With. 197 /13/.
Greatest voltage loss (U):
, (7.8)
where P
— active power transmitted through the line in normal mode is assumed to be 5425.7 kW — formula 3.31;
Q
- reactive power transmitted along the line in normal mode is assumed to be 1216.3 kVAr - formula (3.32);
r
– active resistance of the line, determined by formula (7.9), Ohm;
X
– line reactance, determined by formula (7.10), Ohm.
Active and reactive resistance are determined:
(7.9)
, (7.10)
where is the specific active resistance of the cable line, taken equal to 0.13 Ohm/km, p.428/4/;
— specific reactance of the cable line, taken equal to 0.075 Ohm/km, p.428/4/;
– line length (initial data) equal to 1.5 km, p.11
So, for a cable with cross section F
=240 sq.mm using formulas (7.8), (7.9), (7.10) we obtain
Voltage loss is 0.6% of . The calculation for choosing sections for voltages of 35 kV and 110 kV is similar to the previous calculation. The results of these calculations are summarized in Table 7.1.
Table 7.1 – Calculation results for the selection of sections for 10, 35 and 110 kV.
| Rated voltage , kV | 10 | 35 | 110 |
| Rated current in normal mode Ip., A | 335,652 | 95,900 | 30,514 |
| Rated current in heavy duty mode Ip.ut., A | 671,303 | 191,800 | 61,028 |
| Wire, cable cross-section, F , mm² | 2x240 | 70,000 | 70,000 |
| Line voltage loss | 0,600 | 0,630 | 0,200 |
Let's carry out a technical and economic calculation of the 10 kV external power supply circuit shown in Figure 7.1
We determine capital costs for external power supply)
(7.11)
where =2 · =2 · 2.59 · 6 = 31.08 thousand rubles. – the cost of all cells with switches and their installation with an indexation coefficient of 6, p. 336 /2/, a = 2.59 thousand rubles. – cost of one cell with this switch, table 10.26/4/;
Where
= 11.28 thousand rubles/km – cost of construction of 1 km of line, p.336/2/ taking into account the indexation coefficient;
L
– line length (initial data) equal to 1.5 km.
So, by (7.11) we have
=31.08 + 11.28 · 1.5 = 48 thousand rubles.
Annual electricity losses in supply lines ( ) are determined by the formula
, (7.12)
where n is the number of supply lines (n=2);
power loss in the line, kW;
— the number of hours of use of the maximum active losses, determined by formula (7.13), hour;
= 671.303A – calculated current in the line in heavy mode, table 7.1;
= 0.167 Ohm/km - active resistance of the line per 1 km length, s. 428 /4/;
L
— line length (initial data) equal to 1.5 km.
2886.2 hours (7.13)
where - 4500 - the number of hours of use of the maximum active load when the enterprise operates in 2 shifts lasting 8 hours each, table 2.1 /1/.
So, according to formula (7.12) we have
2 3 671.303² 0.167 1.5 2886.2 =19548.9 t.kWh/year
The cost of annual electricity losses in the designed electrical installation is calculated using formula (7.5)
1.07 19548.91 = 20917.334 rubles/year
Depreciation charges on the line ( ) are calculated according to formula (7.4)
= 947.52 rubles/year
where a
= 5.6 – for 10 kV overhead line, s. 548/4/;
11.28·1.5 = 16.92 thousand rubles.
We calculate depreciation charges for VMPE type switches in the same way as calculated using formula (7.4)
RUB 2,921.52/year.
where = 9.4, s. 548/4/;
31.08·10³ thousand rubles.
So, annual operating costs (Ie)
we calculate according to the formula
(7.14)
=24786.374 rub./year
Let us calculate the annual reduced costs of external power supply schemes using formula (7.1)
24786.374+0.33·48000=40626.37 rub./year,
Where
The calculation results for variants II and III of the scheme, in Figures 7.2 and 7.3, are obtained in a similar way. The calculation results are summarized in Table 7.2.
Table 7.2 Results of calculations of costs for external power supply
| Articles expenses | Option number | ||
| 10kV | 35kV | 110kV | |
| 1 | 2 | 3 | 4 |
| Switch type | VMPE-10 | MKP-35 | MKP-110 |
| Brand and section of the supply line | ASB-2x240 | AS-3x70 | AS-3x70 |
| Brand of supply line support, installation method | In the trench | Reinforced concrete single-chain | Reinforced concrete single-chain |
| Capital costs for switches, thousand rubles. | 31,08 | 109,20 | 400,800 |
| Capital costs for the line, thousand rubles. | 16,920 | 18,090 | 22,140 |
| Total capital costs (K), t.rub. | 48,000 | 191,820 | 261,400 |
| Electricity losses (t.kWh/year | 19548,91 | 122,285 | 9868,995 |
| Cost of electricity losses (), rub./year | 20917,334 | 20543,817 | 1657,991 |
| Depreciation charges on the line (), rub./year | 947,52 | 502,648 | 619,920 |
| Depreciation charges for switches (), rub./year | 2921,520 | 10264,800 | 37675,000 |
| Annual operating costs, ( ), rub./year | 24786,374 | 26635,497 | 11624,690 |
| Reduced costs (), rub./kW | 40626,37 | 89936,097 | 97886,690 |
Based on the results summarized in Table 7.2, we accept a standard voltage of 10 kV for the plant’s external power supply system, since in this case we have the best economic indicators.
Selecting a power supply scheme.
⇐ PreviousPage 2 of 14Next ⇒Choosing a rational power supply scheme along with choosing voltage
is one of the main issues to be resolved when developing a project for the reconstruction of the power supply system. Both of these issues are considered inextricably linked with each other.
The designed circuit must include elements of the existing one if their capacity corresponds to the new design conditions. This also applies to transformer substations, high voltage switchgear, cable lines, conductors and other elements. If it is necessary to replace cable or overhead lines, their cross-sections are selected based on the fuel and energy regulations /9/.
The electricity distribution scheme is built in compliance with the principles of bringing high voltage closer to consumers, eliminating cold reserve, separate operation of the line and transformers, and deep sectioning. Scheme
should be simple, easy to use, repairable, and provide for the use of complete electrical equipment and industrial installation methods. When choosing a scheme, the development prospects of the enterprise for 8-10 years must be taken into account. The existing external power supply scheme is analyzed from the point of view of ensuring the required degree of uninterruptible power supply. If necessary, new lines and transformers are added.
Types of schemes:
1) Radial
2) Trunk
3) Mixed
Factors influencing the choice of scheme:
1) Consumer category for reliability of power supply
2) The location of the workshops relates. Each other and the power source
3) Electrical operating mode. Equipment in the workshop, which determines the workshop load schedule
Radial scheme - power supply is carried out by lines that do not have energy distribution along their lengths (Fig. 1, a). Such lines are called radial. In the power supply of cities, radial lines are called feeders. Lines W1—W4 in Fig. 1, a - radial. Power supply for consumer P1 in Fig. 1, but is produced by two lines W1 and W2. This scheme is called radial with redundancy. In order to increase reliability, lines W1 and W2 of category I receivers are connected to different NIPs.
Fig.1. Power supply diagrams: a—radial; b—main; c— mixed
Trunk circuit - lines feeding consumers (receivers) have energy distribution along their length (Fig. 1 b). Such lines are called trunk lines (W line). When connecting TP backbones (at a pass-through TP), it is advisable to use power switches with protection on some of them on the supply or outgoing lines in order to localize the damaged section of the network and limit the number of TPs that are disconnected.
Mixed scheme - power supply is provided by radial and main lines. In Fig. 1c, line W1 is radial, W2 is main, i.e. the circuit is mixed.
The advantage of radial schemes: maximum simplicity; An emergency shutdown of a radial line does not affect the power supply to other consumers.
Disadvantage: high consumption of cable products leads to high cost of the system. In addition, with single radial lines, the reliability of power supply is low.
Trunk circuits have the following advantages:
— better load of lines, since each line is connected not to one, but to a group of TP;
— less cable consumption;
— fewer switches need to be installed on the CPU and RP.
The disadvantages of single mains are difficulties in finding the location of damage to the main and lower reliability of power supply compared to a radial circuit. The latter is explained by the fact that the reliability of the main line is influenced by the reliability indicators of the HV side of the transformer substation, including power transformers. The use of two-way power supply to single lines (loop circuit) does not solve the problem of ensuring reliability and solving difficulties in finding the location of the fault. Double lines with two-way power supply (double-beam circuits) can provide sufficient reliability of power supply to all categories of electrical receivers. This has led to their widespread use in the power supply of cities.
By comparing the listed power supply schemes, the following conclusions can be drawn.
1. The simplest and meeting the requirements of the III reliability category are networks made according to a radial scheme without redundancy and with single highways.
2. The requirements of reliability category II are met by widely used mainline multi-beam circuits, most often double-beam.
3. It is convenient to supply power to category I receivers using radial circuits with redundancy, as well as two-beam circuits. In all cases of power supply to category I receivers, an ATS must be used.
Voltage selection
The choice of level U is influenced by:
1) Category of the premises according to the risk of damage to electricity. Electric shock
2) Class of electrical equipment according to protection method
A) class 0 - equipment in which protection against electrical damage. Electric shock
provided with basic insulation, while there is no electricity. connection of exposed conductive parts, if any. In case of breakdown of the main insulation, protection must be provided by the environment. B) class 1-equipment in which protection against electrical damage. current is provided by basic insulation and connection of exposed conductive parts accessible to touch with the protective conductor of a stationary installation.
B) class 2 - equipment in which protection is ensured by the use of double or reinforced insulation. Equipment of this class does not have protective grounding and environmental protection properties. Media are not used as a protective measure.
D) class 3 - equipment in which protection is based on power from a source of safe extra-low U and in which U does not occur above the safe extra-low value.
3) Neutral operating mode
4) Type of light sources
5) Suspension height of lamps
6) Lighting system
⇐ Previous2Next ⇒
What makes your dreams come true? One hundred percent, unshakable confidence in your...
WHAT HAPPENS IN ADULT LIFE? If you are still connected to your mother in the wrong way, you are avoiding separation and independent adult existence...
System of Protected Areas in the USA The study of specially protected natural areas (SPNA) in the USA is of particular interest for many reasons...
What Causes Trends in Stock and Commodity Markets Freight Train Theory Explained My first 17 years of market research consisted of trying to figure out when...
Didn't find what you were looking for? Use Google search on the site: