Handbook for setting up secondary circuits - Vector diagrams in current and voltage circuits
Page 4 of 58
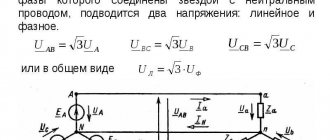
Vector diagrams in current and voltage circuits Analysis of the correct installation and connection of measuring current transformers TA and voltage TV, the implementation of secondary current and voltage circuits, as well as the correct activation of relay protection devices, as a rule, is carried out using vector diagrams. The vector diagram determines the position of the measured current or voltage vectors relative to a symmetrical three-phase system of phase or linear voltages in the corresponding coordinate system. To assess the correct activation of directional protections, vector diagrams must be taken relative to the voltage supplied to these protections. In other cases, when only current circuits or only voltage circuits are connected to the protection, for example, when testing differential and maximum current protection, negative sequence filter protection, vector diagrams can be taken relative to any voltage system synchronous with the connections being tested. Vector diagrams when checking relay protection and measurement devices are usually taken with a VAF-85 device; it is possible to use a wattmeter or phase meter for this purpose, but the use of these devices significantly complicates the work and increases the likelihood of possible errors. When taking phasor diagrams, a previously tested symmetrical voltage of 100 V is supplied to terminals A, B, C of the VAF-85 device from the secondary windings TV, connected in a star with alternating phases a, b, c. In the direction of rotation of the phase meter rotor, the phase rotation of the supplied voltage is checked; if the rotation of a, b, c is correct, the rotation occurs clockwise. The phase is indicated by a dial, which is marked in degrees: the zone to the right of zero (0-180°) is capacitive (C); the zone to the left of zero (0—180°) is inductive (L); during measurements, not only the measured angle is recorded, but also the zone in which it is located. When taking vector diagrams at an “extraneous” synchronous voltage of 110, 220 V, the rules for working with the device remain unchanged. When constructing vector diagrams, the recommendations set out in § 1.2 for preliminary testing of the instruments used for measurement are taken into account. Construction of vector diagrams in voltage circuits. It is customary for all tests to always connect the polar end of the measured voltage vector to the terminal of the device with the designation "", the non-polar - to terminal U. When graphically depicting the current voltage vector, the polar end is marked with an arrow; when written in letters, the polar end corresponds to the first letter. When a VAF-85 is prepared for operation, the voltage zero setting is checked and adjusted by measuring the phase of the base voltage. The value and phase of all voltages of the secondary windings of TV connected according to star and open delta circuits are measured. Based on the data obtained in the coordinate system of the voltage supplied to the device, a vector diagram is constructed, according to which the actual performance of the voltage circuits is assessed. In the absence of VAF-85, the correctness of the voltage circuits can be assessed from the potential diagram taken with a voltmeter, if you first check their phase rotation with a phase indicator. Using a voltmeter, first measure the values of all phase and line voltages of the star Uао, Ubo, Uco, Uаь, Uic, Uca\ relative to terminals A, B, C, N, determine the grounded phase and then measure the voltages of each vertex of the open triangle VI (/(), F, U, H relative to terminals A, B, C, N of the star. Based on the results obtained on a scale (when working with VAF-85 by voltage value and phase, when working with a voltmeter only by voltage values using the notch method), a vector diagram is constructed (see Fig. 1.27.6). A detailed method for determining the grounded phase is given in § 1.6. Construction of vector diagrams in current circuits. To analyze the performance of current circuits using a vector diagram of currents, it is necessary to establish the value and direction of the active and reactive powers flowing through a given connection. By the nature of the primary load, direction and value of active and reactive powers, the expected position of the secondary current vectors on the diagram is assessed, taking into account the connection diagram and the transformation ratio of the TA. The calculated data is compared with the measurement results. The value and direction of power are determined using the appropriate wattmeters and checked with the power system dispatcher. In cases where there are doubts about the correctness of determining the direction of the power of the connection being tested, choose another test mode that eliminates the possibility of doubt, for example, measurements are made in the one-way power supply mode or on the capacitive current of the power line. In the one-way power supply mode, the active power at the supply end has a clear direction from the buses to the line, and at the receiving end the direction of active power is towards the buses. On long power lines, testing can be effectively carried out on the capacitive current of the line when it is disconnected from the opposite side; in this case, the current in a phase leads the phase voltage of the same name by 90°. Depending on the types of supports, the dimensions of the insulator strings, and the cross-section of the wires, the capacitive current in phase per 100 km of length is approximately for power lines 220 kV - 25 A, 330 kV - 45 A, 500 kV - 100 A, 750 kV - 200 A. Directional stability and the values of active and reactive powers when taking vector diagrams must be periodically monitored. It is a mistake to determine the direction of power based on the readings of ammeters of adjacent connections, since currents, depending on the nature and magnitude of the load of connections, can be at different angles, and therefore arithmetic addition and subtraction of currents is unacceptable. In general, the primary current vector can occupy any position in one of the four quadrants on the vector diagram. When determining the quadrant in which the current vector is located, it is necessary to proceed from the following: the positive direction of active, reactive power and current is usually considered to be the direction from the busbars to the line;
the phase vector of positive active power (current) is considered to be in phase with the vector of the same phase voltage; the phase vector of positive reactive power (current) is considered to be 90° behind the vector of the same phase voltage, therefore positive reactive power corresponds to an inductive load. Rice. 1.22. Position of the current vector of phase A in the coordinate system for different directions of active and reactive powers. Thus, the coordinate system has vertical and horizontal axes: vertical axis P, positive direction of active power and phase voltage Uao - upward; horizontal Q axis, positive reactive power (current) voltage - to the right; I, IV - inductive quadrants; II, III - capacitive quadrants (Fig. 1.22). When preparing the VAF-85 device for taking vector diagrams in current circuits, visually check whether the current clamps are connected to the device in compliance with polarity, and use one of the above methods to check the current zero setting. When measuring vector diagrams of secondary currents, there is a constant rule - the current clamps with the polar side are always placed towards the polar terminals of the current transformers. When gripping an insulated current-carrying conductor with pliers, it is necessary to ensure that the planes of the magnetic circuit are completely adjacent without gaps or distortions. The phase of voltage and current is measured in compliance with a mandatory condition - the direction of rotation of the dial and the direction of rotation of the arrow to zero must coincide.
- Back
- Forward
Types of vector diagrams
Vector graphics are well suited for correctly displaying variables that determine the functionality of radio devices. This implies a corresponding change in the basic parameters of the signal along a standard sinusoidal (cosine) curve. To visualize the process, harmonic oscillation is represented as a projection of a vector onto the coordinate axis.
Using standard formulas, it is easy to calculate the length, which will be equal to the amplitude at a certain point in time. The tilt angle will indicate the phase. The total influences and corresponding changes in vectors obey the usual rules of geometry.
There are high-quality and accurate diagrams. The first ones are used to take into account mutual connections. They help make a preliminary assessment or are used to completely replace calculations. Others create taking into account the results obtained, which determine the size and direction of individual vectors.
Pie chart
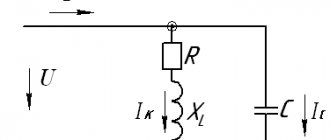
Let us assume that we need to study the change in current parameters in a circuit for different values of resistor resistance in the range from zero to infinity. In this circuit, the output voltage (U) will be equal to the sum of the values (UR and UL) on each of the elements. The inductive nature of the second quantity implies a perpendicular relative position, which is clearly visible in part of figure b). The triangles formed fit perfectly into the 180 degree circle segment. This curve corresponds to all possible points through which the end of the vector UR passes with a corresponding change in electrical resistance. The second diagram c) shows a current lag in phase by an angle of 90°.
Line chart
Shown here is a two-pole element with active and reactive conductivity components (G and jB, respectively). A classic oscillatory circuit created using a parallel circuit has similar parameters. The parameters noted above can be represented by vectors that are constantly located at an angle of 90°. A change in the reactive component is accompanied by a movement of the current vector (I1...I3). The formed line is located perpendicular to U and at a distance Ia from the zero point of the coordinate axis.