Page 8 of 33
QUALITY OF ELECTRIC ENERGY 4.1. GENERAL PROVISIONS Power supply systems and electrical receivers are designed in such a way that the best functioning is achieved when they are powered from a single-phase or symmetrical three-phase system with a voltage of a given amplitude and sinusoidal shape with a frequency of 50 Hz. However, in real electrical networks, for known reasons, deviations from ideal parameters occur, which leads to deterioration in the operation of electricity consumer installations, manifested in technical and economic damage. Inattention to the quality of electricity during the operation of power plants leads to a progressive breakdown of the power supply and disruption of the operation of electrical receivers. Deviations in power quality indicators are also the result of the impact of consumer electrical installations on the ES. Power quality indicators can be divided into two groups. The first group includes deviations of frequency and voltage from the nominal ones, eliminated by power supply systems.
The second includes frequency and voltage fluctuations, asymmetry and distortion of the shape of voltage and current curves, which manifest themselves mainly in areas affected by special electrical receivers that cause these distortions. The degree of this influence is determined by the ratio of the power of these electrical receivers and the parameters of the electrical system. In addition, there are electrical receivers that are sensitive to various types of interference. The conditions in which this interference occurs are not constant, since the ES in combination with consumer installations are constantly evolving: the parameters of the systems, the composition and power of electrical receivers change. Therefore, the quality of electricity is the object of control. Compliance with the quality of electricity is associated with the use of: a rational system of quality indicators that determine the limits of deviations and electromagnetic compatibility of equipment connected to the general network; measuring instruments that allow you to easily assess the quality of electricity and outline reasonable measures to improve it; technical means to improve the quality of electricity; methods for optimal management of power quality in power plants. Deviations from ideal performance should be limited. Therefore, there are norms for permissible deviations, fixed in state standards for power quality. These standards have been adopted in all developed countries, and taking into account the experience and development of power supply and power consumption systems, they are gradually changing in relation to real conditions. In the USSR, power quality indicators at network points to which receivers are connected are standardized by GOST 13109-87. It is necessary to standardize the quality of electricity in power supply nodes, which are the boundaries of the balance sheet of networks. Deviations of power quality indicators from ideal are divided into normal and maximum permissible. During 95% of the day (22.8 hours), power quality indicators should not go beyond the limits of normally permissible values, and during the entire time, including post-emergency modes, they should be within the maximum permissible values (Table 4.1). In emergency situations in the ES, it is allowed for quality indicators to go beyond the established limits, including a decrease in voltage to zero level and a frequency deviation of up to ±5 Hz, with their subsequent restoration to the maximum values permissible for post-emergency modes.
*Rozenkron Y. K., Bimanis V. V. Temperature and current protection of transformers from emergency and systematic overloads // Electrical engineering, 1985, No. 8, pp. 36-38.
Table 4.1. Permissible deviations of power quality indicators
| Indicator name | Acceptable value of the indicator | |
| normal | maximum | |
| Frequency deviation, Hz | ±0,2 | ±0,4 |
| In post-emergency modes, a frequency deviation of ±0.5... - 1 Hz is allowed, the total duration per year is no more than 90 hours | ||
| Voltage deviation (%) in the electrical network voltage, kV: | When determining voltage deviation, voltage dips and voltage pulses are not taken into account | |
| UP TO 1 | ±5 | ±10 |
| 6—20 | — | ±10 |
| In transient mode, short-term voltage deviations outside the established limits are permissible | ||
| Voltage fluctuation range (%) (see §4.3): at the inputs of lighting installations with incandescent lamps in rooms where significant visual stress is required, and at points of electrical networks to which consumers with such installations are connected at the inputs of lighting installations with incandescent lamps in in other premises, including in residential buildings and at points of electrical networks to which consumers with such installations are connected at the inputs of lighting installations with fluorescent lamps and other receivers of electrical energy and at points of electrical networks to which consumers with such installations and receivers are connected | — | According |
| with curve 1 Fig. 4.13 In accordance | ||
| with curve 2 Fig. 4.13 In accordance with curve 3 of Fig. 4.13 | ||
| Dose of voltage fluctuations (%2) in the electrical network to which lighting installations are connected: | The indicator “dose of voltage fluctuations” in existing electrical networks is introduced as they are equipped with appropriate devices, using which the assessment of the permissibility of the range of voltage changes at the inputs of lighting installations is assessed according to the curves in Fig. 4.13 it is allowed not to produce | |
| with incandescent lamps in rooms where significant visual strain is required | 0,018 | |
Continuation of the table. 4.1
| Acceptable value of the indicator | ||
| Indicator name | normal | maximum |
| with incandescent lamps in other rooms | — | 0,034 |
| with fluorescent lamps | — | 0,079 |
| Non-sinusoidal coefficient (%) in the electrical network voltage, kV (see § 4.5): | ||
| UP TO 1 | 5 | 10 |
| 6—20 | 4 | 8 |
| 35 | 3 | 6 |
| 110 and above | 2 | 4 |
| Coefficient of the harmonic component of voltage of odd (even) order (%) in an electrical network with voltage, kV (see § 4.6): | ||
| UP TO 1 | — | 6 (3) |
| 6—20 | — | 5 (2,5) |
| 35 | — | 4 (2) |
| 110 and above | — | 2 (1) |
| Negative voltage sequence factor (%) (see § 4.4) | 2 | 4 |
| Zero sequence voltage factor (%) (see § 4.4) | 2 | 4 |
At the inputs of receivers that are sources of electromagnetic interference, the values of quality indicators may exceed acceptable limits, if this does not lead to a violation of the standard for other power receivers.
4.2. FREQUENCY DEVIATION
The steady state frequency is common to the UES. Frequency changes are caused by changes in the total load and the characteristics of the turbine speed controllers. In the steady-state operating mode of the EPS, frequency changes contain several harmonic components. This is explained by the fact that periodic changes in the total load with a main period of 24 hours are superimposed by random changes with periods calculated in minutes and seconds. High EPS powers and modern frequency and power control systems have led to a decrease in the amplitudes of minute and second frequency changes, which are weakly expressed. As a rule, they do not exceed 0.1 Hz and their influence on the operation of electrical receivers can be neglected. Large frequency deviations result from slow, regular load changes with insufficient active power reserves. Changes in frequency exceeding 0.2 Hz significantly affect the technical and economic results of the operation of electrical receivers. Therefore, the permissible (with a probability of 0.95) frequency deviations are equal to ±0.2 Hz, and the maximum permissible deviations are ±1.0 Hz. Deviation of frequency from the nominal one causes the occurrence of electromagnetic and technological components of damage. The electromagnetic component of the damage leads to an increase in energy consumption for transmission. It is believed that a decrease in frequency by 1% is accompanied by an increase in energy consumption for transmission by 2%. The technological component causes a decrease in the productivity of technological equipment, requiring additional operating time for enterprises. In some cases, enterprises are forced to compensate for this damage by using more efficient equipment (pumps, fans), which consume an excess amount of electricity at normal frequency. Maintaining a normal frequency comes down to ensuring the necessary power reserves in the EPS.
Causes of frequency deviation in electrical systems
As is known from the TOE course, in normal steady state, the total power generated by all generators in the electrical system must be exactly equal to the total power of all electrical receivers connected to the system at the moment. In this case, the rotation speed of the system generators (and they all rotate synchronously), and therefore the frequency
in the electrical system, must remain constant and equal to the nominal
−
50 Hz (in the USA, Japan and a number of other countries 60 Hz).
Any imbalance between generated and consumed power causes a change in the rotation speed of the generators, i.e., the frequency in the system.
In case of emergency shutdown
one (several) generators or
connecting
powerful loads in the system, there is a shortage of active power.
The electrical load (their current output) on the generators remaining in operation increases. At the same time, the turbines of these generators begin to slow down, which leads to a decrease
in the frequency in the system.
Automatic frequency regulators (AFCs) increase the supply of steam to turbines (or water to hydraulic turbines) and their speed (power) increases; accordingly, the voltage frequency generated by working generators increases to the nominal value.
Such frequency maintenance is possible only if there is an active power reserve in the generators, that is, if the generators were partially underloaded until the moment in question. If all power reserves are exhausted, the system cannot restore frequency.
When disconnected
powerful loads, excess generated power appears in the system, since the power generated by the generator turbines at the first moment remains unchanged, which leads to
an increase
in their speed and, accordingly, the frequency in the system. At the same time, the speed regulators of the steam turbines come into effect, which slightly reduce the steam supply (in hydraulic turbines, the water supply), thereby reducing the power generated by the generator until a new power balance is achieved in the system.
The speed controllers of steam turbines operate quite quickly, so load shedding leads to a slight increase in frequency and its rapid restoration to the nominal value. In hydraulic turbines, regulators act more slowly and their rotation speed (frequency) can increase to 120 - 140%.
19) The influence of frequency deviation on the operation of electrical receivers, the requirements of regulatory documents for frequency deviations.
The influence of frequency deviation on the operation of electrical receivers and electrical systems
A slight decrease in frequency (a few tenths of a hertz) does not pose a serious problem for the electrical system, but such a decrease in frequency does not have a favorable effect on the operation of consumers. As the frequency decreases, the rotation speed of electric motors (especially asynchronous ones) and, accordingly, the performance of the mechanisms they drive decrease.
At some enterprises, a deviation from the nominal frequency can lead to disruption of production technology; a decrease in frequency by 3–5% disrupts the operation of radio equipment and a number of automatic control devices. As the frequency decreases, the reactive power of transformers and rotating machines increases sharply, which reduces the efficiency of electrical networks.
A decrease in frequency has an extremely negative effect on the operation of thermal power plants. So, for example, a decrease in frequency by 3–5 Hz entails a 20–40% reduction in the supply of water to the condenser by circulation pumps. This leads to a decrease in the available power (the power that can be generated) of the station, which in turn leads to a further drop in the frequency in the system. This dangerous phenomenon is called “frequency avalanche”.
Requirements of regulatory documents for AFR devices
According to the PUE [11], the automatic frequency reduction device must prevent the operation of the electrical system at frequencies below 45 Hz, the operating time with a frequency below 47 Hz should not exceed 20 s, and with a frequency below 48.5 Hz - 60 s.
GOST for power quality [8] normalizes the following frequency deviations:
— normally permissible deviations (in normal operating modes)
±0.2 Hz;
— maximum permissible deviations (in post-emergency modes)
±0.4 Hz.
Operating principle of AFR, categories and queues of AFR
Operating principle of the AChR
An emergency reduction in frequency caused by a sudden significant deficit of active power is fleeting in nature - a few seconds. Therefore, only automation can counter this decline. Initially, the automation uses all active power reserves in the system. Serviceable generators of the system take on the maximum load (taking into account permissible short-term overloads).
If after these automatic actions the frequency continues to decrease (which indicates an active power deficit that has not been eliminated), the only way to equalize the amounts of generated and consumed power is to turn off some of the least critical power receivers.
Such shutdowns are carried out by special electrical automation devices - frequency shedding machines - AFRs.
AFR devices, as a rule, are installed at substations of the electrical system; they can be installed directly at consumers, but under the control of the electrical system [8].
PUE [8] divides AChR devices into two categories: AChRI I and AChRI II.
First category – АЧРI
designed to prevent a deep decrease in frequency at
the initial moment of the accident development
.
These devices are fast-acting (with time delays tAFR
≤ 0.5 s) and frequency response settings from 47 - 48 Hz to 46 - 46.5 Hz. To implement ACPI, consumers are disconnected in small groups, according to priority. The first-stage power receivers are switched off, for example, when the frequency drops below 48 Hz. If the frequency decrease continues, the power receivers of the second stage are switched off with a setting of 47.5 Hz, then the third - with a setting of 47 Hz. The minimum difference in the frequency settings of the nearest queues is assumed to be 0.1 Hz. AChRI is equipped with approximately 75 - 80% of the total electrical load equipped with AChRI.
Second category – AChRIII
designed to restore the frequency if it
remains low for a long time
, figuratively speaking, “freezes” at a level of about 48 Hz. The frequency settings for ACHRII are taken to be the same and 0.5 Hz higher than the upper setting for ACHRI. Unlike AChRI, significant time delays are introduced into the operation of AChRI II in the range of 15 – 90 s, differing from each other by 5 s. Such relatively long shutter speeds are necessary to connect power reserves, in particular, to start hydrogenerators. Approximately 20–25% of the total electrical load equipped with AChRII devices are equipped with AChRII devices.
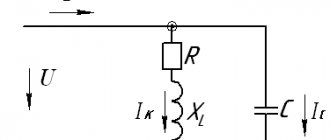
21) Electrical diagram of the AFR device on electromechanical
relay, circuit operation.
In Fig.
Figure 7.1 shows a diagram of an AFR device using a constant operating current using electromechanical or electronic relays. KF frequency relay
(electromechanical type IVCh-3 with induction operating principle or electronic type URCH-3M).
KF
relay controls the frequency of the primary network through the measuring voltage transformer
TV
.
When the frequency drops below the set point, the KF
closes its contact in the
KT
.
The direct operating voltage generated by the UGV
(for example, type BPZ-401) is supplied to the winding of the
KT
(type EV-100 or VL-68).
The latter, after a given time delay, will close its contact KT
in the circuit of windings of the indicating relay
KH
(type RU-21) and the intermediate relay
KL (
type RP-23). A detailed description of these relays is given in laboratory work 1 and 2.
The intermediate relay closes its contacts KL1 and KL2,
by sending trip commands to the breaker actuators
Q1
and
Q2.
The switches operate, turning off the electrical receivers connected through them.
Closed contacts KL3
form a command to prohibit automatic reclosure.
KH
indicator relay signals the maintenance personnel about the fact of operation of the AFR device.
4.3. VOLTAGE DEVIATIONS
Voltage deviation, %, where U is the current voltage value; UNOM - rated voltage. The effective voltage value in single-phase electrical networks is considered to be the voltage of the fundamental frequency U{1) (without taking into account harmonic components), and in three-phase current networks the value of the positive sequence voltage of the fundamental frequency U1(1). With a non-sinusoidal coefficient not exceeding 5%, it is possible to measure the effective voltage value instead of the effective voltage of the fundamental frequency. The change in voltage is a consequence of a change in load over time, causing a change in the voltage drop in the network elements. Voltage deviations also depend on the voltage level at the power points of the electrical network; they change over time in accordance with changes in the total load, i.e. slowly.
V is voltage deviation. A similar designation for voltage deviation, as well as in combination with other symbols for designating voltage components expressed as a percentage of the nominal voltage, was adopted to simplify the formulas used in the book. Voltage deviations are different at different points in the network. Normal operation of electrical receivers is ensured provided that the voltage deviations at their input are equal to ±5% of the nominal (with a probability of 0.95). The maximum permissible voltage deviations are ±10%. The influence of voltage deviations on the operation of electrical receivers. The relative change in luminous intensity, power consumption, and service life of incandescent lamps with voltage deviations is characterized by the equation Here η can be taken as follows (Fig. 4.1): for luminous flux, lm, (U) -3.61; for luminous efficiency, lm/W, (2) -2.0; for power, W, (3) - 1.58; for service life, h, (4) — (—13.57). The operation of fluorescent lamps is less dependent on voltage deviations. Taking into account the ballasts for two lamps, their consumption can be expressed as follows: Their service life changes by 4% with a voltage deviation of 1%. Relatively small voltage changes have little effect on the luminous flux of the lamp. With large drops in voltage, the lamps either do not light up or blink, which sharply reduces their service life. The illumination of workplaces significantly affects labor productivity. According to available data, a decrease in illumination by 1.5-2 times reduces labor productivity by 1-2%. In addition, illumination affects vision, which deteriorates sharply in low light conditions. Considering that illumination depends on voltage, quite stringent requirements are imposed on it.
Rice. 4.1. Characteristics of incandescent lamps in relative units Voltage deviation significantly affects electrothermal installations. A decrease in voltage leads to an increase in the duration of the technological process cycle, and in some cases (with large deviations and the absence of temperature regulators) the process cannot be completed at all. Voltage reductions also have a strong impact on electrolytic installations. Large deviations in household power supply networks lead to the widespread use of voltage stabilizers. Scarce transformer steel is consumed in their production. The use of stabilizers causes energy losses in steel and the consumption of significant reactive power, causing both additional energy losses for its transmission and voltage losses in the network. Rice. 4.3. Dependence of reactive power consumed by asynchronous motors of various powers on voltage deviations. Voltage deviations also affect the operation of asynchronous motors. The speed of their rotation, and therefore their performance, depends to some extent on the voltage (Fig. 4.2). The reactive power consumed by the motors also depends on the voltage (Fig. 4.3). Rice. 4.2. Variation of rotation speed of asynchronous motors depending on voltage deviation for different loads
Voltage monitoring in the distribution network is carried out in order to determine whether or not it is necessary to make adjustments to the mode settings due to changes in power supply conditions. After setting up the mode, you can not further control it for some time. The frequency of monitoring is approximately determined by seasonal changes in loads. Considering that voltage monitoring is carried out to check the need for mode correction, it is necessary to have a preliminary idea of which mode is desirable. Preliminary information includes an idea of the network model corresponding to Fig. 4.4. The personnel knows whether or not counter-regulation of voltage is carried out on the CPU buses, as well as from which PTs consumers who have a different load schedule than the majority of network consumers are powered, for example, three-shift production. The use of preliminary information makes it possible to judge which of the recorded voltage deviations correspond to the maximum and minimum network loads. For example, from Fig. 4.4 it follows that when using counter voltage regulation in the initial sections of the distribution network, the maximum positive voltage deviations can correspond to maximum loads, and the range of voltage changes is less than the range of counter regulation. If during the measurement process a significantly larger range of changes in voltage deviations is recorded, then the relationship is reversed (maximum voltages correspond to minimum loads, and minimum voltages correspond to maximum loads). To obtain information, you need to install devices on the network for some time that make and record measurements in a form that requires little labor to decipher and, if possible, indicates the necessary action if it is necessary to improve the quality of the voltage. To improve the quality of voltage, measures are being developed regarding means of installation and voltage regulation. Rice. 4.6. Changing the voltage graph by shifting it to AU The means of setting the voltage include: PPV taps of distribution transformers, unregulated capacitor banks and voltage level settings of automatic voltage regulators of CPU transformers. Switching the off-circuit switch and putting into operation unregulated capacitor banks on the LV side of the RT leads to a voltage shift without changing its nature (Fig. 4.6). Changing the voltage regulator setting shifts the voltage of all RTs powered by the CPU. Rice. 4.7. Changing the voltage graph by affecting the range of voltage changes: 1 - original voltage graph; 2 - settable voltage graphs
The means of voltage regulation include the counter-control setting of the CPU regulator, adjustable capacitor banks, as well as other means of regulation that change the configuration of the voltage graph (Fig. 4.7). These means serve to introduce the voltage change into the desired range. After using the control means, it may be necessary to change the positions of the off-circuit taps or use other means of setting the voltage. It is not practical to use indicating and recording instruments to obtain information about voltage deviations, since processing the information requires a lot of labor. Measurements can be made by devices that transmit information through a channel to an analyzing computer. Information is also recorded on computer storage media, from which it is then read and analyzed on a computer. You can use special compact devices such as statistical ones that measure, store and pre-process information in a form convenient for subsequent use. Considering that voltage deviations must be within normalized limits with a probability of 0.95, it is advisable to present information in the form of a distribution density or the probability of going beyond the norms. In this case, the following is determined: — the range within which the voltage deviation turns out to be; — the location of this range relative to the desired area. The information obtained in the form of a histogram (Fig. 4.8) is convenient for use. Histograms are: narrow, unbiased; narrow offset; wide, unbiased; wide offset. If the histogram is narrow and unbiased, then the position with voltage deviations is normal. If the histogram is narrow, it is necessary to change the branch of the RT PBB to shift it to the desired area.
Rice. 4.8. Histograms of voltage deviations: a - narrow, unbiased; b - narrow, offset; c - wide Considering that the displacement is fixed and the nature of the process does not change, after changing the working branch, re-measurement is not required. Wide histograms indicate that either the CPU does not have counter-voltage regulation (its range is insufficient), or that additional local regulation or network reconstruction is necessary. After changing the position, repeated control is required. The algorithm for monitoring voltage deviations in the distribution network is shown in Fig. 4.9. The measurement was carried out in a network with counter voltage regulation in the CPU. The range of counter voltage regulation can be determined using the histogram obtained for the CPU buses, which turned out to be equal to 8%. Out of 20 measurements, in 15 cases the histograms were narrow and unbiased. On these RTs the position is normal. In three cases, the histograms turned out to be narrow, shifted towards high voltages. On these RTs it was necessary to change the branches of the PBB. In one case, the histogram turned out to be wide, which, as it later turned out, was explained by the presence of a three-shift consumer at the initial section of the network. This consumer must apply a local voltage regulation device (linear regulator or regulated capacitor bank). Otherwise, it is necessary to reduce the range of counter voltage regulation, which worsens the voltage of all other electrical receivers. From the above it follows that the possibility of changing the means of setting the voltage without subsequent control allows one to focus on information in the form of the integral density of the distribution of voltage deviations, which makes it possible to judge quite accurately (for practical purposes) the situation and the measures necessary to improve it.
Rice. 4.9. Algorithm for monitoring voltage deviations The requirements discussed above apply to the voltage at the terminals of electrical receivers. Monitoring voltage deviations in other nodes of the electrical network is associated in most cases with a comparison of measurement and calculation results, which require identifying the time functions of processes. The exception is the busbars of LV networks (0.38 kV), the voltage on which should usually be in the range of -2%. Control can be carried out for periods corresponding to the annual maximum and minimum loads at points characterizing the mode and taken on the basis of knowledge of the distribution network and operating experience. The current level of operation for each distribution network requires the presence of a mathematical model implemented on a computer. Using the model, you can determine the mode of voltage deviations on the buses and select the best range of counter voltage regulation. Measurements of voltage deviations in electrical networks in this case serve to check the reliability of the model and allow adjustments to be made to it if necessary.
- Back
- Forward
Voltage deviation
The voltage deviation is normalized only at the ED inputs, that is, in fact, only in 0.4 kV networks and at some points in 6–10 kV networks to which high-voltage motors can be connected. They are characterized by the “steady-state voltage deviation” indicator, which is the average voltage deviation over an interval of 60 s. Normal and maximum permissible values of steady-state voltage deviation are equal to ±5% and ±10% of the rated voltage of the electrical network, respectively.
The values of the steady-state voltage deviation in the TOP in networks of 6–10 kV and above should be set taking into account the need to comply with GOST standards at the ED inputs. This means that voltage deviations in other networks are not numerically normalized; they are obtained as a result of calculations.