Functional diagram of automation
The automation diagram for the development of a process control system is a kind of integrated functional diagram of a technological control object, covering the so-called “field equipment” of the lower level of the system and showing its connections with instruments, control computer equipment and monitoring and control points of a higher level.
The automation scheme is carried out taking into account the requirements of section 2 of GOST 2.702-75* ESKD, clause 2.4 of GOST 24.302-80, section 4.1 of RD 50-34.698-90 and section 4.3 of GOST 21.408-93 SPDS.
The automation scheme is developed as a whole for the technological control object of the automatic control system or for a separate engineering system (power supply, heat supply, ventilation, etc.) or part of the technological/engineering system, process and operation: line, section, block, installation, unit.
Example: functional diagram of steam boiler automation
The functional diagram is developed on the basis of the initial materials for the creation of process control systems and, first of all, the materials of the technological regulations or individual documents included in the “technological regulations”.
The best option for a functional diagram of TOU automation is a diagram combined with a connection diagram, which is made as part of the main set of grade T in accordance with GOST 21.401-88 SPDS or with connection diagrams of engineering systems.
The implementation of a combined scheme is allowed in clause 3.3 of GOST 21.404-88 “Production technology. Basic requirements for working drawings."
In foreign practice, the development of PID circuits (Process Instrument Diagram) is used. The development of a combined scheme by specialists in technological processes (technological equipment, OV, VK, EM, etc.) together with specialists in the development of process control systems (including the lower, “field” level) provides the most effective solutions in both parts of the project (for example, TX and ATX).
Since such a diagram is issued with two signatures (TX and ATX), any change in part of the TX automatically becomes the property of the ATX developers, which eliminates many conflict situations that arise when documents are issued separately - separate TX connection diagrams (OV, VK, etc. .) and separately ATX automation circuits.
The automation scheme (AS), when developed separately from the release of the TX (AV, VK, etc.) sniffing scheme, must be agreed upon with the relevant specialists of the technological (plumbing, heating and ventilation, etc.) part of the project.
It should be noted that in the connection diagram (TX, OV, VK) in accordance with clause 3.2 of GOST 11-88, “... pipelines and their elements” with all alphanumeric designations must be indicated.
Here are some explanations of some terms.
Technological unit - a complex or assembly unit of technological equipment of a given level of factory readiness and manufacturability, intended for the implementation of main or auxiliary technological processes. The unit includes machines, apparatus, primary monitoring and control equipment, pipelines, support and service structures, thermal insulation and chemical protection.
Blocks, as a rule, are formed to carry out heat transfer, mass transfer, hydrodynamic, chemical and biological processes. The nomenclature of blocks is established by departmental regulatory documents agreed with the ministries carrying out installation work.
Process pipeline is a pipeline designed to transport various substances necessary for conducting a technological process or operating equipment.
Pipeline elements - branch pipes (pipes), bends, transitions, tees, flanges, compensators, shut-off, control, safety valves, supports, gaskets and fasteners, devices installed on pipelines for monitoring and control, condensation and other parts and devices.
Devices installed on pipelines for monitoring and control are shown as pipeline elements on a wiring diagram or combined diagram.
Alphanumeric designations are placed on the shelves of leader lines and correspond to the drawing number of the element.
An element (embedded element) is a part or assembly unit that is inextricably built into technological devices and pipelines (boss, fitting, pocket, sleeve, etc.).
In accordance with SNiP 3.05.07-85 “Automation Systems”, such an element is called an embedded structure or an embedded element.
The embedded structure or embedded element must ensure the necessary tightness of the process equipment and pipeline before installing the automation device on them. This allows hydraulic and pneumatic testing of equipment and pipelines to be carried out before the installation of automation devices, before the start of installation and commissioning of automation systems and process control systems.
A sampling device is a device installed on process equipment or a pipeline and designed to supply the measured medium to measuring instruments or measuring transducers (sensors).
Note that according to clause 2.12 of SNiP 3.05.07-85, embedded elements or structures for the installation of primary devices, for the installation of selective devices for pressure, flow and level, etc. (ending with shut-off valves), individual flow meters, flow meters, regulating sensors and shut-off elements, bypass lines (bypasses), materials for the manufacture of embedded elements (structures) are provided and specified in the technological part of the project (TX, OV, VK).
Development of structural and functional diagrams of automatic control
Functional diagrams explain certain processes occurring in individual functional circuits of the product or in the product as a whole. These diagrams are used to study the principles of operation of the product, as well as for their adjustment, control, and repair.
A functional diagram, compared to a structural diagram, reveals in more detail the functions of individual elements and devices.
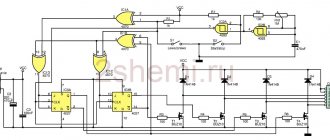
Functional diagrams are the main technical document that defines the functional block structure of individual units of automatic control (Figure 7), control and regulation of the technological process and equipping the control object with instruments and automation equipment (including telemechanics and computer technology).
Automation problems are solved most effectively when they are worked out during the process development process.
During this period, the need to change technological schemes is often identified in order to adapt them to the automation requirements established on the basis of a technical and economic analysis.
The creation of effective automation systems predetermines the need for an in-depth study of the technological process not only by designers, but also by specialists from installation, commissioning and operating organizations.
When developing functional diagrams for process automation, it is necessary to decide the following:
-obtaining primary information about the state of the technological process and equipment;
— direct influence on the technological process to control it;
— stabilization of technological process parameters;
control and registration of technological parameters of processes and the state of technological equipment.
These tasks are solved on the basis of an analysis of the operating conditions of technological equipment, identified laws and criteria for managing the facility, as well as the requirements for the accuracy of stabilization, control and recording of process parameters, for the quality of regulation and reliability.
Functional automation tasks[1], as a rule, are implemented using technical means, including: selected devices, means of obtaining primary information, means of converting and processing information, means of presenting and issuing information to service personnel, combined, complete and auxiliary devices.
Figure 7 — Functional diagram of the automatic control system
RI (regulator-measuring device) is a single-channel PID controller for measuring and regulating temperature. Recommended for high temperature accuracy requirements
TC (thermal converters) - temperature measurement. They are selected based on the operating temperature range, design features and operating conditions. Can be supplied with a normalizing transducer NPS built into the head.
SK (power switch) - electromagnetic starter. Used for switching power circuits with currents above 50 A.
KU (switching device) is a power supply and relay containing a stabilized 24 V voltage source and a group of 3 electromechanical relays. It is used to power the pumping station, as well as to organize signaling.
UEP1 (power supply device) - a network filter is designed to suppress high-frequency and pulse noise and limit pulse overvoltages in amplitude in the supply network. Significantly increases the stability and reliability of the system.
UEP2 (power supply device) - power supplies for the interface converter.
IU (interface device) - mutual conversion of electrical signals from RS232/RS485 interfaces with galvanic isolation between them, data transfer to a PC to build a data acquisition system.
Software (software) - software for controlling the operation of a network of regulators, as well as for collecting and recording data, displaying process parameters, archiving process parameters on a PC, setting settings and managing timing diagrams.
It is recommended to develop structural diagrams of automation in automation projects in accordance with GOST 24.302-80. System of technical documentation for automated control systems. General requirements for the implementation of schemes.
The graphical construction of the diagram should give the most visual representation of the sequence of interaction of functional parts in the product. On the interaction lines, it is recommended to use arrows to indicate the direction of the processes occurring in the product.
Figure 8 — Block diagram
2.2.Development of algorithm and automatic control loops
An algorithm is understood as a set of instructions that determine the process of converting source data into the desired result. The following properties of the algorithm are assumed:
— certainty (determinism), i.e. accuracy that does not allow arbitrary interpretations of the essence of the instructions;
— mass character, i.e. the possibility of choosing a system of initial quantities from some potential infinite set;
— effectiveness, i.e. the property of defining a process that, for any acceptable initial data, leads through a finite number of steps to obtain the desired result.
Recording an algorithm in the language of a specific computer is called a program, and its microstructure elements will be commands. A command is information presented in a form that allows it to be entered into a computer and determines the actions of the machine for a certain period of time.
Documentation of algorithms for automated process control systems tasks is carried out both on human-readable media (schemes, texts, etc.) and on machine media using high-level algorithmic languages. It has the following main functions:
— formalizes the principles and methods of solving problems;
— records the composition of information used and output by each algorithm and system of algorithms;
— allows you to make, take into account and control changes in algorithms during their debugging and refinement;
— provides the possibility of mutual exchange of information between specialists participating in various stages of algorithm development;
— makes it possible to expand the functions and modernize the process control system by connecting new algorithms;
— allows you to use the developed algorithms in various automated process control systems, as well as use their basis when replacing computers.
It is advisable to divide the set of algorithms used in production management systems into four groups:
— collection of initial information;
— centralized control;
— optimal control;
— implementation of control actions and presentation of information to the dispatcher.
Due to poor visibility and ambiguity, verbal descriptions of automated process control system algorithms are used only at the initial stages of development, when it is necessary to explain the essence of the problem being solved.
Graphical (graphoanalytical) methods are the most common form of recording process control system algorithms, since they can be used to describe various levels of detail.
A flowchart is a graphical representation of the sequence of operations according to which a solution to a problem is obtained. Each section of the block diagram is depicted as a standard symbol that has certain functions (GOST 19428-74).
Inside the outlines of the symbols, a short name of the actions performed by the operator is given. An identifier may be placed above the symbol (to the left of the flow line), as well as some additional information. The symbols are connected by flow lines, with the preferred directions being left to right and top to bottom. Only one line comes out of each symbol (except for the “transition” symbol), and at least two lines come out of the “transition” symbol. In the latter case, conditions indicating solution options are indicated above each line.
In accordance with the assignment of the diploma project, an algorithm for automatic control of workpiece annealing was developed. It consists of a series of operations performed in a specific order. After applying the supply voltage, the registers of the microcontroller and the LCD display are initialized. Next, the installation mode flag is checked. If there is no setting, then the display shows the values of the indication registers of this mode.
After the display, the temperature sensor is initialized. Next, the program checks the state of the buttons and makes the appropriate settings. The button test is completed by rewriting all values into the display registers. After completing all operations, the program waits for an interrupt.
During the interrupt, the seconds, minutes and hours registers are set and recoded. After the interrupt has been processed, the program returns to the display and the temperature measurement cycle is repeated.
The diagram of the enlarged control algorithm is shown in Figure 9.
Figure 9 — Automatic annealing control algorithm
The furnace is started from the STOP mode at the operator’s command, and there should be no reasons preventing the furnace from starting. The permission to ignite the stove is controlled automatically. The operator selects the operating mode.
After the operator gives the START command, the system switches to the operating mode. The heat exchange chamber of the furnace is purged with air for 300 seconds. Next comes the heating mode. In this mode, heating elements (heating elements) are heated. Afterwards it is checked whether all elements were exposed to heat. If the heating indicator signal does not appear on at least one wall of the oven, a message is displayed and operation stops.
With the positional method, full power is supplied to the heater until the set temperature is reached, after which the power supply is stopped. Despite this, the heated heater continues to give off heat and the temperature of the object continues to increase for some time, which leads to overheating, sometimes significant. When the object subsequently cools down, upon reaching the set temperature value, full power is supplied to the heater again. The heater first heats itself, then the surrounding areas of the object, and thus cooling will continue until the heat wave reaches the temperature sensor. Consequently, the actual temperature may be significantly lower than the set value. Thus, with the positional control law, significant temperature fluctuations around the set value are possible. This disadvantage can be reduced or even completely eliminated by applying the proportional-integral-derivative control law (PID law). PID involves reducing the power supplied to the heater as the object's temperature approaches the set temperature. In addition, in the steady-state control mode, according to the PID law, the amount of thermal power required to compensate for heat losses and maintain the set temperature is determined. The proportional-integral-differential control law provides significantly higher accuracy of temperature maintenance than the positional one. The power N that must be generated by the heater, expressed as a percentage of its maximum power, is calculated by the formula:
(1)
Where
Kp, Ki, Kd - proportional, integral and differential control coefficients, respectively (PID coefficients). The first term in the expression (proportional component) is directly proportional to the “residual” ∆T = Tс − Т∆– the difference between the temperature set point Tс and the measured temperature value T. Its meaning is that with the “residual” ∆T = Кр (in °С ) the regulator will begin to reduce power. The second term in the steady-state control mode is equal to the amount of thermal power required to compensate for heat losses at ∆T= 0.
2.3.Calculation of the main reliability parameters of the automated control system
An automated control system (ACS) is characterized by three parameters:[2]
— resistance to external influences;
- quality;
— reliability.
Due to the lack of experimental data on the operation of the system, it is impossible to construct the transfer functions of the control object, so this section will consider the structural calculation of reliability.
Let us imagine an automated control system in the form of successive links, each of which is characterized by a failure rate.
In our case, these links are: PLC, actuators in the form of sensors.
Let us determine the probability of failure-free operation of the main elements of the system using formula (2):
P=exp (-λt)=e λt , (2)
Where
P-probability of failure-free operation;
λ —failure rate;
T-time period.
For time, let's take a period of a year, and this is 1971 working hours in 1 shift.
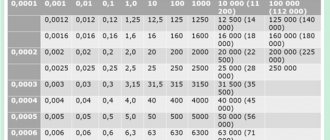
Table 2 gives a list of the main elements and the magnitude of the failure rate.
Table 2‒ Failure rates of elements[3]
| Element | Element failure rate λ,1 hour |
| PLC | 5,3·10-6 |
| temperature sensor | 3,3• |
| Pressure meter | 3,5• |
Calculation of the probability of failure-free operation for selected elements:
1) P1=exp(-5.3• •1971)=1.044
2) P2=exp(-3.3• •1971)=0.650
3) P3=exp(-3.5• •1971)=0.689
Calculation of the total probability of failure-free operation:
P1•P2•P3 =1.044•0.650•0.689=0.467
The probability of failure-free operation of the main circuit of the automated furnace temperature control system is 0.467.