One of the leading indicators characterizing the operation of an enterprise is the production capacity utilization rate. Persons involved in organizing the labor process need to know what this parameter describes and how its value is determined.
The ratio provides information useful for optimizing the production process
Determination of the coefficient
This ratio shows how much production equipment is used in practice, compared to the figure achieved at the maximum possible load on the line. It is one of the indicators of a company’s productivity and makes it possible to evaluate the effectiveness of the technologies and work methods used, and to identify problems with the rational operation of machines. This will contribute to better alignment of the production process and optimization of equipment use.
Important! The coefficient can be used not only to evaluate the performance of a factory, workshop or other industrial enterprise, but also for a company engaged in trade or providing services to the public. This is how they determine how productive the team and the technical means used are.
Information collection method
At first, data for calculating real and potential power values is collected manually and entered into specially prepared reports. Once the second value has been established, subsequent calculations can be automated based on available data and trends.
Calculation of equipment utilization indicators
After analyzing the general indicators of the efficiency of using fixed assets, the degree of use of the enterprise's production capacity, individual types of machinery and equipment is studied in more detail. Analysis of equipment operation is based on a system of indicators characterizing the use
1) Indicators of the degree of attraction of equipment into production
There are equipment available and installed (put into operation), equipment that is actually used in production, is under repair and modernization, and reserve. The greatest effect is achieved if the first three groups of equipment are approximately equal in size.
To analyze the quantitative use of equipment, it is grouped by degree of use (Fig. 2).
Rice. 2. Composition of available equipment
To characterize the degree of equipment involvement, calculate:
— coefficient of utilization of the available equipment fleet (Kn):
Кн = Number of operating equipment / Number of available equipment;
— utilization rate of the installed equipment fleet (Ku):
Ku = Number of operating equipment / Number of installed equipment;
— utilization rate of equipment put into operation (Ke):
Ke = Number of installed equipment / Number of available equipment.
If the indicator values are close to one, then the equipment is used at a high degree of utilization, and the production program corresponds to production capacity.
2) Indicators of the degree of utilization of the enterprise's production capacity.
The production capacity of an enterprise means the maximum possible output of products at the achieved or planned level of equipment, technology and production organization. In other words, this is the maximum potential opportunity for production of products by a given enterprise during the reporting period.
Production capacity is not a constant value and changes along with the improvement of equipment, technology and production organization. It is calculated based on the capacity of leading workshops, sections, units, taking into account the implementation of a set of organizational and technical measures aimed at eliminating bottlenecks, and possible production cooperation.
The degree of utilization of the enterprise’s production capacity is characterized by the following coefficients:
1.General coefficient:
Ko = Actual or planned volume of production / Average annual production capacity of the enterprise;
2.Intensive load factor:
Ki = Average daily production output / Average daily production capacity of the enterprise;
3. Extensive load factor:
Ke = Actual or planned working time fund / Estimated working time fund adopted when determining production capacity;
In the process of analysis, the dynamics of these indicators, the implementation of the plan for their level and the reasons for their changes, such as the commissioning of new and reconstruction of existing enterprise assets, the technical re-equipment of production, and the reduction of production capacity, are studied.
In addition, the level of use of the enterprise's production space is analyzed: output in rubles. per 1 m3 of production area.
One of the most important factors influencing the efficiency of using the operating system is improving the use of the production capacity of the enterprise and its divisions. To establish the relationship between capital productivity and production capacity, use the following factor
model:
FO = VP/VPos. VPos/ W . W/Wasp . OSa/OS,
where VP is the volume of production taken for calculation;
VPOC - main (core) products of the enterprise;
W is the average annual production capacity.
This formula allows you to determine the impact on the dynamics of capital productivity of changes in the level of specialization of the enterprise (VP/VPOC); production capacity utilization factor (VPOC/W); capital productivity of the active part of the operating system, calculated by production capacity (W/OCa); the share of the active part of the funds in their total value (OSa/OS).
3) Characteristics of extensive and intensive loading of equipment
.
To characterize the extensive loading of equipment, the use of equipment by time
: the balance of operating time and its shift ratio.
Table 1. Indicators characterizing the equipment use time fund
| Time fund indicator | Symbol | Calculation formula | Notes |
| Calendar fund | Tk | Tk = Tk.d. 24 | Tk.d - number of calendar days for the analyzed period, days. |
| Nominal (regime) fund | TN | Tn = TP.CM. tcm | TP.SM - number of work shifts for the analyzed period tcm - duration of the work shift, hour |
| Effective (real) fund | Tef | Teff = Tn - Tpl | Tpl – scheduled repair time, hour |
| Useful (actual) fund | Tf | Tf = Tef - Tpr | Tpr – time of unscheduled downtime, hour |
The level of intra-shift equipment use is characterized by the equipment load factor K3, which allows you to estimate the loss of equipment operating time due to scheduled maintenance, etc.:
Kz = Tf / Tk or Tf / Tn or Tf / Tef
The level of conditional use of equipment is characterized by the shift coefficient (Kcm):
Kcm = Actual number of machine shifts worked per period / The maximum possible number of machine shifts worked by installed equipment for 1 shift of the period.
Intensive loading of equipment as an assessment of its performance.
Equipment intensive load factor (Ci) is determined:
Ki = Actual average hourly output of equipment / Planned average hourly output of a unit of equipment.
A general indicator characterizing the complex use of equipment is the integral load indicator (Kint):
Kint = Kz. Ki.
Calculation formula
What is power factor
The basic formula used to calculate the coefficient is as follows:
K = Vfact/Msr,
Where:
- Vfact is the volume of products manufactured over a certain time,
- Мср – average production capacity for the same time period.
Formula for finding power utilization factor
The production capacity formula used in the calculations is calculated using additions and disposals on the enterprise's balance sheet over the past period (usually annual). The power of a certain type of equipment can be calculated in two ways: using the labor intensity of a unit of production or the productivity of one piece of equipment.
Production Capacity Formulas
Target values
As a guide, you can use 80%, which is the average for United States firms. In Europe it is slightly higher – 82%.
Calculation of annual fleet mileage
The formula shows that the main delay in the operation of production vehicles can be caused by a poor level of organization of repair and maintenance work. As a rule, the actual readiness indicator differs from the planned one.
When transporting cargo of small volumetric mass, it is necessary to increase the sides of the cargo platform, which allows for fuller use of the vehicle's carrying capacity. When transporting containerized cargo, multi-tiered stacking is used. In this case, it is necessary to comply with the established overall dimensions and ensure reliable fastening of the stacked rows of cargo.
Cars and trailers listed on the balance sheet of the enterprise, regardless of their technical condition, constitute the list (inventory). The list number of cars and trailers of each brand can be established at any time using the vehicle fleet accounting sheet and corresponds to accounting data.
The composition of the enterprise's vehicle fleet is characterized by the presence of trucks of various brands with different carrying capacities, and buses with different capacities. Therefore, indicators are calculated that reflect the total carrying capacity of trucks and the total passenger capacity of the bus fleet.
The presence of relative values in the balance (the share of each element in the overall total of vehicles) allows comparison with previous periods and identification of the most important causes of downtime.
Ensuring the same level of output coefficient for each inventory unit of rolling stock (bus) is impossible, therefore, to calculate the annual standard number of vehicle days in operation, the average standard is used.
The GARANT system has been produced since 1990. and its partners are members of the Russian Association of Legal Information GARANT.
The required (necessary) value of the coefficient of production of cars on the line should be determined in the optimal amount from the position of interests of both the organization and the consumer. From the position of a motor transport organization, the value of the coefficient reflects the possibility of operating rolling stock and generating income, and from the position of a consumer, the opportunity to use the services of rolling stock.
Measurement Features
Introduction to Demand and Usage Ratio
The data used for future calculations is collected manually every working day. If possible, automatic data recording is organized - this will help to spend less time and labor resources to find the real workload indicator. The potential indicator is calculated for a certain time period and then substituted into the formula.
Important! The final coefficient can be determined both for a single machine or line, and for a workshop or enterprise as a whole. So for different scales, data is recorded at different frequencies: statistics for an individual machine are collected several times a day (for example, once an hour), and for the entire company it is calculated over a longer period: monthly, seasonal or annual.
Mileage utilization rate (KUR)
Determines the degree of utilization of the vehicle's mileage with cargo.
When a car is operating on a line, mileages are distinguished:
general, loaded, idle and zero.
Total mileage
is the distance in kilometers traveled by a car during a working day.
A loaded run is a productive run.
Idle mileage
- this is the mileage of a vehicle without cargo between unloading and loading points.
Zero mileage
is the mileage of the vehicle from the depot to the loading point and from the last unloading point to the depot, as well as travel for refueling.
The mileage utilization coefficient is determined by the formula:
where:
Sгp — mileage with load, km; So.pr - total vehicle mileage, km.
Example.
The total mileage of the car per day was 320 km, with cargo - 244 km. Determine KIPR.
Solution.
The value of the mileage utilization factor depends on the location of loading and unloading points, the nature of cargo flows and the organization of dispatch service on the line. Innovative drivers are achieving reductions in unproductive miles driven by transporting associated cargo. For example, when transporting sugar beets from the field to the sugar factory, they use return flights to transport mineral fertilizers to the fields.
Standard and interpretation of meaning
Transformation ratio
The indicator under consideration does not have a clear fixed regulatory framework. For different categories of firms, the boundaries of the target range will be different, especially when applied to human resources. However, the resulting figure may indicate the following:
- If the result is below 0.7, technological processes are not organized rationally, and there is a need to change work strategies (optionally also in additional production capacity).
- At a higher value, operational efficiency can be increased internally by the enterprise.
- If the coefficient is equal to one (100% utilization), the resources owned by the company are used to the maximum. If there is a goal to produce even more products, the purchase of additional units of equipment will be required. The coefficient cannot exceed 100%.
Important! The final figure may be influenced by a number of third-party factors: a sudden change in the situation at the company or in its environment, competing companies, changes in demand.
Calculation example
You can get an idea of the methodology, for example, based on the performance indicators of a plant producing pellets. For each of the types of equipment used (mills for various purposes, a drying drum, an apparatus for forming granules, etc.), the planned and actual volume of processed raw materials in cubic meters is recorded and the coefficient is calculated on their basis. You can divide the month into three decades and generate statistics for each of them and for the month as a whole.
For example, the most productive of the machines used was the drum. Then the coefficient value will be the highest. If you want to increase the productivity of other types of machines, they need to be loaded more intensively. The higher the coefficient of a particular machine, the greater the load relative to its potential it bears. 80-85% is a good indicator, but even in this case, it is acceptable to strive for an increase due to the presence of 15-20% of spare capacity.
How to calculate utilization rate
In an economic review of an enterprise's activities, calculations of coefficients characterizing production productivity are used. So, say, to assess the equipment load, its utilization .
Instructions
1. Select a fixed asset (or a group of them) and evaluation parameters to review the performance of the asset . The use of workshop machines can be assessed by the time of their operation or by the volume of products produced, the use of trucks - by the number of tons - kilometers of cargo transported, etc. Let’s imagine that you need to calculate the utilization of weaving shop equipment for a month based on their operating time. There are ten machines in the workshop, the staff works in two twelve-hour shifts. 2. Determine the planned working hours for the analyzed period, taking into account the established operating mode. To calculate it, you can use a production calendar if the enterprise operates on a five-day working week. If shifts are established in production, then the planned working hours are calculated based on the approved shift schedules. In this example, the planned load of one machine for a month will be equal to: 30 days per 24 hours = 720 hours. 3. Determine the number of hours of actual operation of the looms in the workshop during the period. To do this, you will need timesheet data. Find the total number of hours worked by shop floor personnel. Let the workers of the weaving shop work 6,800 man-hours in a month, which corresponds to the actual operating time of the machines. 4. Calculate the indicator of the use of the equipment of the weaving workshop using the formula - Ki = (Fr/S)/Fp, where: Fr - the actual number of hours worked by all machines, hour, C - the number of machines in the workshop, pcs, Fp - the planned working time fund, hour. In this example, the utilization will be: 6,800/10/720= 0.94. Consequently, the looms of the weaving shop were used at 94% per month. The remaining 6% is his downtime. Likewise, you can calculate the rate of use of any fixed asset (or group of them) for the period that concerns you.
coefficient is used to review the financial stability of an enterprise. It shows the share of equity in the total assets of the enterprise. This indicator characterizes the degree of financial autonomy of the enterprise from external creditors.
You will need
- -accounting balance of the enterprise;
- -calculator.
Instructions
1. To acquire more accurate calculations, you must first create an aggregate balance based on the existing accounting balance. Such an intra-equilibrium reform does not violate the structure of assets and liabilities; it allows the articles to be combined according to the economic table of contents. coefficient can be calculated without drawing up an enlarged form of equilibrium. In this case, you can easily take the data from Form No. 1, while it is advisable to increase the “Capital and Reserves” item by the amount of “Costs of future periods”. 2. Using the data obtained, the autonomy indicator is calculated by dividing the amount of equity by the total assets of the enterprise. 3. Personal funds represent the community of financial sources of the enterprise, formed from the funds of the founders and the results of the financial activities of the organization. In the balance sheet, they are reflected in the “Capital and Reserves” section, line 490. You can also determine the amount of equity using the following formula: Personal funds = Liabilities – Borrowed capital. Borrowed capital includes long-term and short-term liabilities. 4. Total assets reflect all property of the enterprise, including physical and intangible assets. They represent the result of the balance sheet asset and are reflected in line 700. 5. coefficient is measured in shares. The normative skeptical value is 0.5-0.7. It is rational to evaluate the value of this indicator over time. The growth of the indicator in dynamics indicates the stability of the enterprise’s activities and an increase in its autonomy regarding external creditors. This indicator is of greatest importance for investors and creditors. The higher its value, the lower the risk of losing their invested funds. Note! When drawing up an aggregate equilibrium, you need to be careful; the result of an asset invariably coincides with the result of a liability.
The development of any plan is associated with advance planning and optimization of work. This is a convenient graphical tool, the use of which allows you to visually depict the technological sequence and connection of events, the commonality of which is the implementation of each plan.
Instructions
1. Every new plan requires meticulous planning. Each work is divided into time intervals, which can be of different lengths, but they all end with the occurrence of one or another event. An event is one of the network planning terms, one that denotes the conclusion of some work. 2. Work is a process over time, one that involves the expenditure of sources, a logical outcome and a responsible performer or group of performers. Each plan, therefore, can be characterized as a set of works. And the event in this case means that the work is completed. Consequently, on the graph, work is depicted in the form of an arrow or a directed arc, and events are depicted in the form of circles and vertices. The commonality of all works is the way. 3. A network diagram is a graphical representation of a set of works in the form of events interconnected like a network. It turns out that events are the main elements of a network diagram , and its parameters are related to the time of work (occurrence of events) and are called temporary. 4. Before building a graph, you need to calculate time parameters . They can be divided into three main groups according to the type of network elements: parameters of events, work and paths. Time parameters of events: early completion date, late completion date and time reserve. 5. The early date of an event is the expected moment of its occurrence. This parameter is equal to the duration of the maximum path, the one that will be covered earlier: t_рс(i) = max t(L_i). 6. An event may have several previous paths i and j, in this case this parameter is equal to: t_рс(j) = max (t_рс(i) + t(i, j)), where t(i, j) is the length of work from event i to event j. 7. The late date for the completion of an event is the limiting point in time by which the event must occur. This parameter is closely related to the representation of path criticality. The longest path on the graph is called skeptical. t_ps(i) = t_cr – max t(L_ic), where L_ic is the remaining path from this event to the final one. 8. Work parameters: • Duration t(i, j) – the number of time units allocated to complete this work; • The early start date of the work coincides with the early date of the preceding event: t_рр(i, j) = t_рс(i); The early completion date is equal to the sum of the parameters of the early start date of the work and its duration t_op(i, j) = t_rn(i, j) + t(i, j) = t_рс(i) + t(i, j);• Late start date work is equal to the difference between the moment of occurrence of the further event and the duration of the work t_пнр(i, j) = t_пс(j) – t(i, j);• The late date for finishing the work coincides with the late date for the completion of the further event t_пр(i, j) = t_ps(j);• Full time reserve. 9. Path parameters: duration and length of the skeptical (maximum) path, as well as travel time reserve. There are several paths on the network diagram, each of which represents a network of work in which the final event of all previous work coincides with the beginning of the next one. The biggest path is skeptical. 10. Temporal parameters associated with the time reserve are of greatest interest. They show how much it is permissible to increase the duration so as not to cause major damage to the term of the plan. 11. Thus, the time reserve of an event is such a period of time that it is possible to delay a certain event and that will not cause an increase in each plan period. The total supply of operating time is a time indicator, one that is equal to the maximum period for increasing its duration without increasing the plan period R_р (i,j) = t_пс(j) – t_рс(i) – t(i, j). 12. The travel time margin is equal to the difference between the duration of the skeptical path and the specific path under consideration R(L) = t_cr – t (L). Note! To increase the efficiency of equipment use, it is necessary to reduce its downtime. To do this, it is necessary to use high-quality raw materials, pay attention to increasing the qualifications of personnel, and replace worn-out equipment with new ones.
Practical application of CMM
Calculating an indicator for a single machine or machine makes it possible to find out the following data:
- are there any episodes of downtime in the work process, and what causes them;
- How in demand is this piece of equipment, and how often is it used;
- what part of the profit is the machine responsible for;
- Is it possible to operate a piece of equipment more efficiently, is it worth upgrading.
Determining the coefficient for the organization as a whole will be able to show:
- how much it is possible to increase the volume of products produced or services provided;
- whether the installed equipment is operated efficiently;
- how busy the production lines are;
- within what limits the cost of products can increase (with a low coefficient, an increase in production volume is possible, associated with an increase in the cost of a single copy).
To determine the potential for increasing production volume, you need to find out the value of the gap (let's denote it P) between the possible and actual quantity of products produced. It is calculated by the formula:
P = (ROP-POP)/POP * 100%,
where ROP is the actual volume of production, and POP is the potential.
Power factor
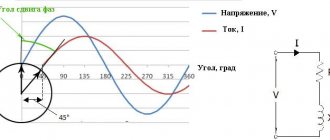
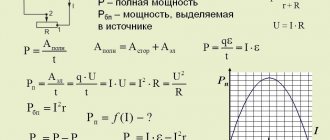
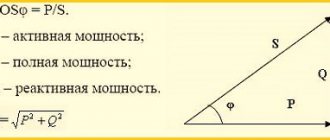
The coefficient, denoted as cos φ, shows the proportion of the highest possible power provided by an alternating electric current due to voltage delay. It is equal to the cosine of the angle of displacement of these two quantities. The range of possible values of the indicator is between zero and one. For fully capacitive (capacitor elements) or inductive (transformers and other devices with coils) circuits, the angle in question will be right, and accordingly, its cosine is 0. Moreover, for elements of the first type, the current leads the voltage, for the second - vice versa. In absolutely resistive circuits, the electric current flows in phase with the applied voltage, the angle is 0, and its cosine is 1. With a fixed power indicator and a constant voltage, the current strength will decrease with increasing cos φ.
Problems with low cos φ
The importance of this indicator is due to its responsibility for maintaining inductive load. When the ratio is too low, the problem may be rooted in a distorted current waveform or a large phase difference between it and the voltage at the load terminals. A coefficient value of one is ideal; a value below 0.8 is definitely insufficient. At low values, a corresponding percentage of power (for 0.8 this is 20%) is retained in the system, which can damage the generator or engine (in particular the bearing elements). This also places an additional load on the wires; they require greater thickness. Having to handle more current results in lower overall efficiency due to increased heat loss.
Solving the problem of low cos φ
Most often, installation of a switched group of capacitor elements parallel to the electrical circuit is used for this purpose. You can set the unit to turn on and off automatically based on the values of various system indicators. More often, capacitors are placed in the primary electrical network of a power substation.
Low coefficient correction is carried out through the use of capacitors
Capacity Requirements Planning (CRP)
The use of these systems aims to increase the efficiency of equipment, teams of employees, and conveyor lines. The point is to plan and find a workload balance to implement the plan to release the final product. It is necessary to plan the required volumes of capacity for each type of product manufactured, taking into account the structure of the technological process. The system generates a report on discrepancies between the required load and the available capacity.
Planning for production capacity requirements
Capacity factor is an important parameter that helps determine how much efficiency a plant, individual production line, or piece of equipment has to improve efficiency. Carrying out calculations using it will help optimize production and identify which equipment and technological processes need modernization or replacement.
Capacity utilization factors
At each enterprise, production facilities operate under the influence of extensive and intensive factors. The final results of all work depend on how effectively they are used.
The extensive use of existing production capacities represents, first of all, an increase in the operating time of equipment over a certain calendar period of time. It also takes into account the amount of actually operating equipment from the total amount of equipment of the enterprise.
In order for equipment to work longer, it is necessary to reduce or completely eliminate intra-shift downtime. In this regard, repair and maintenance of equipment must be timely and of high quality. The main production cycle continuously receives the required number of workers, raw materials, materials and energy. As a result, it is possible to significantly increase the equipment shift ratio.
In addition, production facilities become more efficient by reducing the amount of unused equipment and bringing into service equipment that was not previously installed or used. This makes it possible to significantly increase production growth and reduce labor losses of workers. However, extensive development has certain limits, beyond which it becomes ineffective. The intensive path of development has greater opportunities.
With intensive use, production capacity increases by increasing the utilization rate of equipment over a certain period of time. To achieve such an increase, existing machines and mechanisms are being modernized. At the same time, the most optimal mode for their operation is selected. Optimization of technological processes allows you to increase the number of products produced, leaving fixed assets and the number of workers unchanged. The production of a unit of product is carried out with lower material costs. To calculate the most efficient use of production capacity, there are special formulas that include basic indicators and coefficients.